
Yahoo Answers is shutting down on May 4th, 2021 (Eastern Time) and the Yahoo Answers website is now in read-only mode. There will be no changes to other Yahoo properties or services, or your Yahoo account. You can find more information about the Yahoo Answers shutdown and how to download your data on this help page.
Trending News

8 Answers
- JohnLv 46 years ago
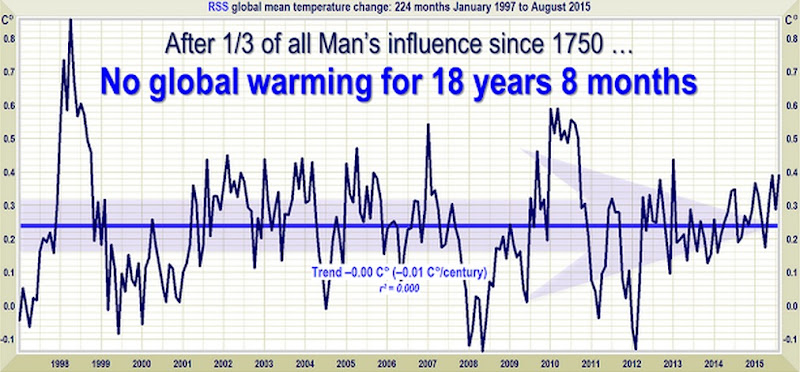
No, it is not, over the history of the planet. Yes, it is, under the current warming of the climate. The natural variations within the climate system do not match the current warming trend in the climate that is being observed now. However, your fake graphic does nothing to support your question either way. How easy is to know that your graphic is fake? 1998 was the warmest year on record globally during the 20th century. Even IF you believed that the climate has not warmed since then it would be only 16 years of no global warming. The charlatans that produced that graphic cannot even do the most basic math problem! Obviously neither can you, if you fell for that lie.
- Anonymous6 years ago
The exaggerated Global Warming Marketing Strategy is like the over-priced and extremely exaggerated housing debacle. Markets were being forced upwards simply because of Government intervention and lowered standards of credit based on the idea that property values would increasingly rise. It was being propped up by a false Government financial backing from Freddie and Fannie. As long as the Government continued to "back the loans up", then investors (banks and financial entities) were happy.
Government-run Climate Science is no different. We have been watching the Climate Clowns of the Government continue to prop up their claims that a "NET CHANGE" in our entire atmosphere of 0.012% is somehow causing an extreme temperature change, yet their predictions of temperature rise by the end of the 21st century keep falling by the way-side. They are now claiming 2.7C rise by the end of the century, which is almost 1/3rd of where this whole debacle started.
Temperature graphs are meaningless IMO. Noticing an overall temperature change of 0.8C in my "neck-of-the-woods" in over 50 years is impossible simply because there is a natural variability of temperature that happens every day by as much as 35 degrees F, and over a 1 year's time frame it varies by as much as 120 F and has for most of that 50 years.
Bottom Line:
If you're looking for something out of the ordinary, you will most certainly find it. That's called "Natural Variability". Interpretations of variations in temperature are extremely volatile when in the hands of BIG GOVERNMENT thinkers. That's why there is an extreme exaggeration of what a 0.012% change in our overall atmosphere is doing to temperatures over the past 350+ years of human industrialization. Measurement techniques are changing and temperatures will surely fluctuate in the hands of BIG THINKERS.
- capitalgentlemanLv 76 years ago
In fact, yes. Your 18.5 year chart demonstrates noting. You have to look for hundreds, or even thousands of years to see the trends. E.g., the Holocene is the time of relative stability, and it is a 10,000 year long period - so far.
One of the keys is CO2 levels. In past warmings, CO2 lagged the warming, but, this one is leading it. That is because much of the CO2 has been produced by human activity. You can see a real change in average global temperatures if you plot the last few hundred years. The marked rise begins about 1850, which is when the Industrial Revolution really began to get under way.
- KanoLv 76 years ago
The rate of temperate rise of the 80' to 2000's was no greater than the rate of rise during 1910 to 1950 when CO2 was not considered a factor, so NO it cannot be considered outside of natural variability.
- MikeLv 76 years ago
No it is not. We know it is not because they had to go to great lengths to destroy the stasis in temperatures over nearly two decades by declaring that they were going to trust temperatures taken from ship intakes in the 1950s over temperatures taken from buoys and ARGO floats. That is how they destroyed 'the pause'.
- Anonymous6 years ago
Bruce, Why are you showing a graph that has a definite positive increase across the time period and acting like it show a downward trend??? Can you not read graphs???
- BruceLv 56 years ago
No, not in amount. but the rate is large. It has beem happening while the Sun has been less bright for half a century.


