
Yahoo Answers is shutting down on May 4th, 2021 (Eastern Time) and beginning April 20th, 2021 (Eastern Time) the Yahoo Answers website will be in read-only mode. There will be no changes to other Yahoo properties or services, or your Yahoo account. You can find more information about the Yahoo Answers shutdown and how to download your data on this help page.
Trending News


Why would a longer sunspot cycle have less of a global warming effect?
This graph from ICECAP (one of my favorite sites) was recently linked in another question.
http://icecap.us/images/uploads/sunspot-cycle-leng...
A similar (if not identical) graph was also shown in one of my favorite films - the Swindle. Coincidentally I'm sure, it omits the past 20-30 years of data.
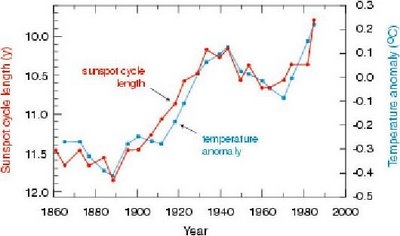
I noticed something else though. The y-axis shows not number of sunspots per cycle - which is a fairly good indicator of total solar irradiance - but rather shows sunspot cycle length (number of years). But not just that, it shows the length in descending order. In other words, a sunspot cycle lasting 10 years corresponded to warmer global temperatures than one lasting 12 years.
So I'm wondering, is any physical mechanism proposed by which a longer solar cycle has less of a warming effect on Earth? I mean, what does the length of the cycle have to do with anything? It seems to me like a 12 year cycle with 70 sunspots would have more of a warming effect than a 10 year cycle with 50 sunspots, and vice-versa.
Anyone know if there's any reasoning behind using this inverse sunspot cycle length metric, or if perhaps it's just a coincidentally decent fit for global temperature data from 1870-1980?
Dawei - interesting observation. Perhaps they're going from minimum to maximum and then multiplying by 2 to get more data points? Or more likely, because using the full solar cycle doesn't produce as good of a correlation.
13 Answers
- Anonymous1 decade agoFavorite Answer
Your question exposed an area of ignorance on my part, so I did some surfing and turned up several interesting sites. I learned all kinds of things -- before I book a trip to Alaska to see the aurora borealis I'll want to know more about sunspot activity that year -- but wanted to share this tidbit from the first link below:
"The periodicity of the sunspot number, and hence that of the circulation in the solar plasma, relates to the rotation of the Sun about the centre of gravity of whole solar system, taking 11.1 years on average. Sometimes the Sun is up to a million kilometres from that centre, and sometimes it more or less coincides, leading to different conditions of turbulence within the photosphere. The transition from one condition to the other affects the number of sunspots."
From the 2nd link:
"By studying the sun's magnetic field, modern astronomers have discovered that the cycle covers twenty-two years, with each eleven-year cycle of sunspots followed by a reversal of the direction of the Sun's magnetic field.
According to Fisher, "the overall magnetic field structure changes in a way that is very interesting. It turns out that if the magnetic fields primarily point from west to east in the Northern Hemisphere (of the sun), they point from east to west in the Southern Hemisphere. In the next eleven-year cycle, the fields are reversed. So the cycle is really twenty-two years."
So now I'm adding another category in my master list of sites relating to climate change, and I think I'll chew on this a bit before trying to jump further into the fray. I've enjoyed the comments thus far, hope there will be other interesting ones to come.
Source(s): http://www-das.uwyo.edu/~geerts/cwx/notes/chap02/s... http://cse.ssl.berkeley.edu/segwayed/lessons/sunsp... http://www.ace.mmu.ac.uk/resources/gcc/2-5-3.html - d/dx+d/dy+d/dzLv 61 decade ago
The earth must rotate about the center of mass for the solar system. If, as Amy's answer indicates, the sun is up to a million km from the center of mass, then there is the possibility that the earth sun distance has a periodic fluctuation of 1/150 (assuming the rest of the planets align in just the right way). The maximum fluctuation in radiance from this effect would be about (1/149)^2 - (1/150)^2 or about 1.35%. This would enough to have a measurable effect on climate, but it would be quite remarkable if the planets aligned in just the right way during recent human history. Perhaps someone can look up the data?
Edit: the data is here
http://ams.allenpress.com/archive/1520-0469/42/9/p...
In brief, the trend in solar insolation is a function of latitude due to changes in the inclination of the earth's axis of rotation. At high latitudes, the long term trend is a decrease in solar insolation of about 0.05% per century (-0.17 W/m^2). At mid latitudes, there is a much smaller increase in solar insolation of about 0.0005% (+0.0017 W/m^2). The trend in solar insolation alone suggests that the polar ice caps should be increasing in extent.
The effect of sunspots is to block outgoing solar radiation. The energy is hypothesized to be stored for 10 years or more, being released in periods of low sunspot activity. The effect of sunspot number is thus to increase the amplitude of the solar cycle. If the solar cycle period is increasing as indicated by the icecap diagram, then the only correlation that could be made to fit (even if it has no physical significance) is decreasing solar insolation with increasing solar period. The icecap diagram is thus suggesting that decreased solar insolation is correlated with increasing temperatures. One can only admire the skill involved in finding a way to flip the sign of the underlying trend. People with such skills could have brilliant careers as used car salesmen or politicians.
- Author UnknownLv 61 decade ago
It certainly appears that the data ha been adjusted to fit the desired outcome.
I find it curious why the version of the chart in your link left out the CO2 concentration line as is found in fig.7 here http://icecap.us/images/uploads/Solar_Changes_and_...
A quick search of the journals I came up with this
quote "simple linear correlation between sunspot number and
total solar irradiance would not account for variations
larger than 0.1% in the long-term" end quote
Source(s): Climate change and solar variability: What's new under the sun? Earth and Planetary Science Letters, Volume 248, Issues 1-2, 15 August 2006, Pages 1-14 Edouard Bard, Martin Frank http://www.sciencedirect.com/science?_ob=ArticleUR... - 1 decade ago
I just thought I would at my two cents regarding the data stopping at 1980. Yes NASA GISS for example goes out of sync after 1980, but this is also the time when many rural stations started to rapidly disapear and more errors were beginning to be returned creating less certainty in the land based temperature record, plus the V2 adjusted increases warming over the raw data. When solar activty is compared with well situated rural stations unaffected by V2 adjustments etc... it still corelates very well still, there are many peer reviewed papers that show correlation to the present day, better more the recent global cooling was predicted successfully based on solar cycles.
The length of the cycle relates directly to solar activity, i.e. a shorter cycle, a more active sun and more intense activity, thus solar winds are influenced differently with varying cycle lengths. Low level cloud, AAR and baseflows in large catchments aswell as flood frequency have all been found to correlate with the solar cycle supporting a climate effect due to solar wind.
The following peer reviewed papers by Friis-christensen discusses the corelation:
http://www.sciencemag.org/cgi/content/abstract/254...
http://www-ssc.igpp.ucla.edu/IASTP/43/
As does this:
http://icecap.us/images/uploads/SOLAR_CYCLE_LENGTH...
There are of course hundreds of peer reviewed papers on the subject, you could try some them aswell.
http://elpub.wdcb.ru/journals/rjes/abstract/v06/ab...
http://www.atmos-chem-phys.net/4/2273/2004/acp-4-2...
http://arxiv.org/ftp/hep-ph/papers/0506/0506208.pd...
http://journals.royalsociety.org/content/77543w3q4...
Edit: Just thought I would add a comment about the graph stopping short by 20-30 years, its from a study published in 1991 hence it doesnt go up to 2008. Moberg et. al., 2005 & Scaffeta & West, 2007 show updated charts that correlate well still. Low level cloud cover and temp also correlates well in Lassen and Friis-Christensen (2007)
Source(s): http://cc.oulu.fi/%7Eusoskin/personal/Sola2-PRL_pu... http://www.gsajournals.org/perlserv/?request=get-d... http://adsabs.harvard.edu/abs/1996GeoRL..23..359C http://www.pnas.org/content/97/23/12433.full http://nzclimatescience.net/images/PDFs/alexander2... http://www.acrim.com/Reference%20Files/Phenomenolo... http://www.fel.duke.edu/%7Escafetta/pdf/2006GL0271... http://www.griffith.edu.au/conference/ics2007/pdf/... http://adsabs.harvard.edu/abs/1994IrAJ...21..251B http://arxiv.org/abs/physics/0005072 - How do you think about the answers? You can sign in to vote the answer.
- DavidLv 71 decade ago
I don't really get that graph. How can there be 24 red dots over 120 years if each one is to represent a "length" of 11 or so years?
The graph only goes from 1860 to 1980, if each point is supposed to track the length of an ~11 year cycle there should only be 12 data points, not 24...
Source(s): Yeah I can't figure it out. It's pretty obvious they manipulated the data just to show there is a correlation; there is no reason not to just plot each cycle as a single point, with the y value fitting that cycle's length and the x value being the median year of that cycle. I bet I could show a correlation between Earth's temperature and orbital tilts of Jupiter if I fiddled around with it enough (inversing? multiplying by two? adding unnecessary data points?) Come on ICECAP, it may be junk science but you can do better than that. - gcnp58Lv 71 decade ago
Any time you see a graph like that where the data showing the correlation between anything to do with solar forcing and temperature anomaly cuts off at 1985, you know it is because if you plot data from 1985 onward, the correlation turns to monkey doo-doo. In other words, this is another case where there are two cycles with similar periods, but are not physically linked. At times, the two cycles beat in phase just through random chance, but it signifies nothing.
There is a good discussion of this on realclimate.org, where one of the principles there shows how Republicans in congress (or something like that) correlate with temperature increase.
- JimZLv 71 decade ago
I don't disagree with GCNP but I notice too that it begins at 1860 and ends prematurely. I find the correlation too great and am skeptical of it. That is certainly doesn't indicate CO2 as a mechanism for climate change so I am assuming you dispute the graph as well. I don't think we understand the cycles of the sun very well. What causes the metallic hydrogen (metallic at the inner pressure of the sun) to form the magnetosphere which changes at 11 year cycles and what is it in the hydrogen / helium fusion process that results in cycles of varying output? Clearly there is a correlation with sunspots and solar output and climate fluctuation. It isn't a perfect relationship however since many factors influence our climate, from winds, solar output, variations in the solar magnetosphere, variations in the earth's magnetoshere, ocean currents, cosmic rays, continent locations, orientations of axis of rotation, distance from the sun, amount of greenhouse gas, amount of clouds, amount of ice cover, amount of volcanic dust, amount of industrial aerosols, amount of water vapor, amount of clouds, etc etc etc.....
- Incipient_planckLv 71 decade ago
No. But there is one scientist who did a study showing a correlation with sunspots and periods of associated droughts.
- SteveLv 41 decade ago
It is sunspot cycle length. The sunspot theore is that,
particles falling from space mean more clouds. The sunspots cause solar winds which mean fewer particles falling and fewer clouds we get lower.
The cycle length will have an effect.
- bravozuluLv 71 decade ago
Sunspots are caused by magnetic storms. The magnetic field of the sun intensifies. Temperatures of the plasma increase UV and X-ray emissions significantly. There is also the increase solar wind. Apparently, those magic particles from outerspace that you don't believe in called cosmic rays are also affected. It is obvious that sun spot are what probably drove climate prior to this century. The exact cause is uncertain but cloud formation is very likely. Like it or not, it wasn't CO2 that drove climate in spite of that simpleton idiot Al Gore's assertion to the contrary. Science has proven him WRONG..


