
Yahoo Answers is shutting down on May 4th, 2021 (Eastern Time) and beginning April 20th, 2021 (Eastern Time) the Yahoo Answers website will be in read-only mode. There will be no changes to other Yahoo properties or services, or your Yahoo account. You can find more information about the Yahoo Answers shutdown and how to download your data on this help page.
Trending News
Does Loehle actually refute Mann in any way?
In a recent answer, Eric C made this statement regarding the graph of Loehle 2008:
"How is the graph provided by Spencer (which he also provides a link to the new study) any different that the updated one in Loehle's new study? It still does not look like anything like Mann's hockey stick"
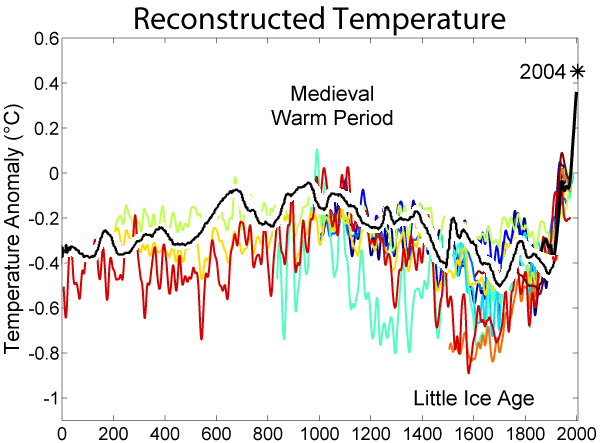
Here's a well known graphic showing paleoclimate for the last 2000 years:
http://upload.wikimedia.org/wikipedia/commons/c/c1...
In this graph, Mann et. al. 1999 (the famous "hockey stick" graph) is in blue, and the updated Mann & Jones 2003 in light yellow.
Here's the corrected, weighted mean graph from Loehle 2008, which, claims Eric C. "doesn't look anything like" Mann.
http://farm3.static.flickr.com/2661/3913429235_191...
Here's Loehle's study superimposed on Mann at the same scale:
http://farm3.static.flickr.com/2666/3914214320_261...
Does Loehle's study in any way refute Mann's conclusion (now the conventional wisdom) that the current climate is warmer than at any time in the past 2000 years?
5 Answers
- TrevorLv 71 decade agoFavorite Answer
To some extent Loehle does refute Mann (as has long been the case), or at least he tries to in a somewhat questionable manner. But, what he also does is to validate Mann's findings and demonstrate once again, that it is necessary for skeptics to be... shall we say... conservative with the truth.
Michael Mann's graph follows the widely accepted norm. Many studies have reproduced very similar graphs. Craig Loehle's is very similar but conveniently omits the recent rapid rise in average global temperatures. Considering this is the crux of the whole global warming debate it does seem a little remiss to have forgotten to include it. Quite clearly it is an omission as no reputable scientist would seek to deceive people by deliberately withholding the facts (would they?).
I use the term 'scientist' quite loosely in my description of Dr Loehle as he isn't actually a climatologist, or even anything closely related, he is in fact a computer consultant and programmer. To be fair, he does have a degree in ecology.
If you want expert advice about the climate ask Dr Mann (who is a climatologist), if you need an expert to develop a computer programme then ask Dr Leohle.
- 1 decade ago
Yes, Loehle absolutely refutes Mann (actually, there is no need to refute Mann as his work has been shown to be riddled with errors and not valid past 400 years). In the 2nd IPCC report, they included a graph clearly depicting the MWP (medieval warm period). The MWP showed that we are not living in the warmest climate ever, and that when the climate was warmer, the earth did not explode.
Along came Mann and his "Hockey Stick". Mann's graph showed that the previous 2,000 years was very stable, and that only in the last 50 years or so has the climate changed significantly. Mann's report was actually featured 6 times in the 3rd report (more than any graph before or since). Mann's graph was used to try and prove that man caused the warming and we were all going to die. Well, even though Mann's report was supposedly peer reviewed, it appears that the process did not work, as his work was worthless.
Loehle's work, on the other hand, clearly shows the well documented MWP, and shows it was world wide, not just in the European area. His work also goes a long way in dispelling the myth that man is at fault and we are all going to die a horrible death.
Here is are some good references.
http://www.john-daly.com/hockey/hockey.htm
This is a good one that shows the timeline of events.
- Dana1981Lv 71 decade ago
No.
Nice graphic, superimposing Loehle on the other reconstructions. Not surprisingly, it's quite similar.
Frankly I don't think it's really possible for Loehle's reconstruction to refute Mann's. Just for starters, it only used 18 proxy reconstructions while Mann et al. 2008 used 1209. How do you refute a study which uses 67 times more data? If the lesser study has different results, it can bring the results of the other study into question, but by themselves will likely not refute them. When you're trying to reconstruct the temperature of the entire planet, taking data from 18 points is not very thorough.
But anyway, clearly there isn't a very significant difference between the two reconstructions. If you add the instrumental temperature record to Loehle's, it has a pretty distinct 'hockey stick' shape as well.
Coincidentally, I find it amusing that the deniers vilify Mann for his supposed statistical errors, yet cite Loehle exclusively on global temperature reconstructions despite the fact that as you noted in your previous question, he had to bring in a statistician to fix the blatant statistical errors in his initial reconstruction. Just a bit ironic.
As another side note, it's always fascinating to see deniers like CrazyConservative (who always lives up to his name) describe their perception about the hockey stick controversy. They all seem to have significantly different descriptions, and none are even remotely accurate. Note that the schematic presented in the IPCC first assessment did not utilize any data (there hadn't been any global temperature reconstructions as of 1990), and was loosely based on Lamb's 1965 paper on Central England temperatures, whereas the 'hockey stick' obviously was a real reconstruction. Shockingly, our scientific knowledge actually improves over time, though it would be more convenient for deniers if that weren't the case.
- Eric cLv 41 decade ago
First of all, lets assume that you did not make any "honest" mistakes when you comprised these chart.
In the original Loehle's study in 2007 he states "The mean series shows the Medieval Warm Period (MWP) and Little Ice Age (LIA) quite clearly, with the MWP being approximately 0.3°C warmer than 20th century values at these eighteen sites."
http://www.ncasi.org/publications/Detail.aspx?id=3...
Lets move on to his revised study. In it he also clearly states the existence of a MWP and LIA.
"The next graph shows the culled average, along with 95% confidence intervals. It may be seen that omitting these two series happens to somewhat attenuate the shape of the reconstruction. Nevertheless, the MWP and LIA are still significant (or right at the margin of significance) over essentially the same period as with the full sample."
Later on the same
"Again, the MWP and LIA are significant over essentially the same period as with the unweighted full sample estimates."
Now if it is your contention that Loehle's study confirms Mann's study, then I was unaware that Mann corrected his study to show an existence of a significant MWP and LIA. But since it does not, I would have to conclude that your analysis was wrong.
Dana: We do not vilify Mann for his statistical errors. We vilify him for his secrecy and hostility when people attempted to replicate his study. As for which study is correct, the historical evidence shows that there was a WMP and LIA.
- How do you think about the answers? You can sign in to vote the answer.
- Anonymous1 decade ago
Mann is in over his head.
He should have studied statistics before writing papers dependent upon them.


